نُشر في بقلم Russell Macfarlaneمن Laundry Link News، July/August 2026 Issue No.13
Expert Guide: The Biggest Sources of Lost Revenue in Commercial Laundries
Where does a commercial laundry really lose money? Often, it’s not through major breakdowns, but through small, hidden inefficiencies that add up over time. This article explores how laundries can improve profitability by tracking labour productivity, machine utilisation, energy consumption and preventative maintenance. Discover practical ways to identify performance gaps, reduce operating costs and unlock greater efficiency across healthcare, hospitality and garment processing operations.
Expert Guide: The Biggest Sources of Lost Revenue in Commercial Laundries
Where does a commercial laundry actually lose money? It is not always through a major breakdown or a dramatic rise in utility prices. Often, the losses are hidden in underloaded machines, idle production time, inefficient labour allocation, unnecessary energy consumption, and equipment that is not operating at its full potential. Understanding these small gaps in performance is the first step towards turning a busy laundry plant into a genuinely efficient and profitable operation.
Benchmarking Floor Output: KPOH vs. PPOH
To successfully transform plant performance from a theory into a predictable system, management must track labour efficiency in real time. The industry standards for measuring this output are KPOH (Kilograms per Operator Hour)and PPOH (Pieces per Operator Hour).
- The Formulas: KPOH tracks total bulk throughput by dividing processed weight by labour hours. PPOH tracks item-level productivity by dividing the total count of individual finished items by the operator hours logged.
- Driving Labour Efficiency: Labour is typically a commercial plant’s largest operational cost. Monitoring KPOH and PPOH instantly exposes floor bottlenecks, underutilised machinery, and workforce friction.
- Targeted Section Tracking: Top-tier plants track these metrics by specific departments, such as the soil-sort line, the wash aisle, the ironer line, and the folding/stacking stations, rather than using a broad facility average. This isolates exactly where productivity dips.
- Incentive Alignment: Publishing daily or shift-level performance data gives floor supervisors clear, actionable targets, boosting operational accountability and aligning staff output with business profitability.
Industry Benchmarks: Healthcare vs. Hospitality
Production targets vary significantly between industries due to the complexity of sorting, finishing, and packaging diverse linen pools.
Healthcare Laundries -
Healthcare operations benefit from highly standardised linen pools (sheets, blankets, and gowns) and high-volume continuous batch washers (tunnel washers). However, strict infection control slows down sorting and loading.
- Target Bulk Benchmark: 45 to 65 KPOH.
- High-Performance Plants: Fully automated healthcare mega-plants utilising automated pack-out systems can push past 75+ KPOH.
Hospitality Laundries -
While hospitality shares high volumes, it demands higher-quality finishing. High-end hotels require extensive ironing, crisp folding, and manual quality checks for stains or tears, which inherently increases operator touchpoints.
- Target Bulk Benchmark: 45 to 65 KPOH.
- Variability Factors: Food and beverage linen (napkins and tablecloths) drops bulk efficiency lower due to intense soil sorting. Conversely, high-volume pool towel processing peaks much higher through automated small-piece folders.
Unlocking Capacity: Tracking Utilisation and Downtime
A plant can boast excellent KPOH numbers during active periods, yet still lose money if expensive capital assets sit idle. True operational maturity requires measuring Machine Utilisation and Downtime against the plant’s true Theoretical Capacity.
- The Capacity Baseline: Theoretical capacity calculates what your equipment should produce if run continuously at maximum rated load per cycle time. If a washer-extractor is rated for 100kg and features a 45-minute cycle, its theoretical capacity over an 8-hour shift is roughly 1,066kg.
- The Utilisation Gap: Machine utilisation tracks the actual runtime against that baseline. Low utilisation rarely stems from mechanical limits; it points to upstream planning errors. Operators waiting for clean linen trolleys, soil-sorting backlogs, or erratic chemical deliveries all cause machinery to sit empty.
- Categorising Downtime: To fix profit leaks, downtime must be rigorously logged into three categories: Scheduled (preventative maintenance, shift changes), Unscheduled Mechanical (broken belts, electrical faults), and Operational (waiting for linen, starvation of a production line).
- The Bottom-Line Impact: When utilisation drops, fixed overheads, such as rent, depreciation, and baseline utility charges, are distributed across fewer kilograms of clean product. Maximising asset utilisation effectively lowers your fixed cost-per-kilo, unlocking massive hidden margins.
Spotting Energy Loss: Auditing Tonnage & Output Against Utilities
While tracking floor labour metrics ensures people are moving efficiently, high KPOH or PPOH metrics do not automatically mean a profitable shift. True cost control happens when management daily cross-references total processed tonnage and hourly piece trends directly against utility consumption curves (gas, electricity, and water meters).
When these metrics drift out of alignment, it reveals invisible, costly operational drain:
- The “Idling” Trap: If floor output dips due to poor material handling or slow linen sorting, machines sit idle while fully powered. Washers remain idle, CBWs remain filled with hot water, ironer chests continue consuming steam, and dryers remain idle and empty. Comparing gas and electricity spikes against flatline hourly tonnage isolates this exact operational drag.
- Underloaded Machinery: Running a 200kg washer-extractor with only 120kg of linen or loading CBW 50kg compartments with 40kg may make loading fast for operators (temporarily boosting sorting metrics), but it consumes nearly the identical volume of water, gas, and chemicals as a full load. Tracking the ratio of Utility Units consumed per Tonne processed immediately exposes under-loading inefficiencies.
- Diagnosing Mechanical Failure: If daily tonnage and pieces per hour remain steady but gas or water consumption trends upward over a week, it points directly to mechanical degradation rather than staff performance. This data disconnect acts as an early warning system for leaking steam traps, scaled boiler tubes, or faulty water valves.
Improving Utility Efficiency
Utility consumption should be monitored alongside production output. Comparing gas, electricity and water usage against tonnage processed can highlight underloaded equipment, unnecessary idle time and changes in machine performance that may otherwise go unnoticed.
Heat recovery can also provide an opportunity to reduce energy costs by capturing heat from wastewater and reusing it to pre-heat incoming water. Systems such as AquaTherm can help commercial laundries reduce the amount of energy required to bring fresh water to operating temperature.
The key is to view utility consumption as part of overall plant performance. When production and utility data are reviewed together, operators can identify inefficiencies earlier and make better decisions about where improvements will have the greatest financial impact.
Hospitality: Elevating Guest Experience and Throughput
In hotels and resorts, linen quality directly shapes guest perception, while turnaround speed dictates labour costs.
- Maximising Capacity: Run commercial washer-extractors at optimal rated weight to prevent water and energy waste.
- Finishing Efficiency: Invest in automated folding and ironer technology to minimise the bottleneck of manual sheet and towel processing.
- Linen Lifespan: Balance chemical pH and thermal parameters to prevent premature fabric degradation, reducing replacement overheads.
Healthcare: The Intersection of Compliance and Productivity
Hospitals and aged-care facilities treat processing as a critical infection control measure, where compliance cannot be compromised for speed.
- Barrier Separation: Utilise physical barrier washers to eliminate cross-contamination risks between soiled intake and sterile output.
- Thermal Disinfection: Strictly adhere to standards like AS/NZS 4146, ensuring correct time and temperature parameters (such as 65°C for 10 minutes).
- Workflow Optimisation: Automate sorting and material handling to protect staff from ergonomic strains and reduce misplaced clinical textiles.
Uniforms and Garments: Precision Tracking and Wearer Appeal
Processing corporate wear, industrial workwear, and high-visibility garments requires meticulous tracking and customised finishing.
- RFID Integration: Implement radio-frequency identification chips to monitor individual garment lifecycles, tracking wash counts and reducing inventory loss.
- Ergonomic Sorting: Use dedicated hanging rails, automated sorting conveyors, and specialised pressing equipment to maintain garment integrity.
- Cost-to-Serve Accuracy: Price contracts tightly based on actual piece weight and soil classification rather than broad averages.
Driving Profitability Through Preventative Maintenance
Sustainable margins in industrial laundering rely on proactive engineering and digital oversight. Cloud-based management systems track real-time utility consumption and water usage, but physical assets must be kept in peak condition.
Implementing the following structured checklist protects equipment lifespans and keeps your floor output metrics high:
Daily Routines -
Clean lint filters: Remove buildup from dryers and ironers after every shift to maintain airflow.
- Inspect water inlets: Check hoses and valves for leaks or visible moisture.
- Verify chemical lines: Ensure dosing pumps feed smoothly without clogs or leaks.
- Wipe drum seals: Clear debris and residue from washer door gaskets.
Weekly Routines -
- Check belt tension: Inspect drive belts on washers and dryers for slack or wear.
- Test safety switches: Verify emergency stops and door locks function instantly.
- Clean ironer chests: Remove wax or chemical residue from ironer plates.
- Inspect steam traps: Check for leaks or sluggish condensate drainage.
Monthly Routines -
- Lubricate bearings: Apply high-temperature grease to main drive bearings.
- Check burner efficiency: Inspect dryer gas burners for a clean blue flame.
- Inspect electrical panels: Blow out dust and check for loose wiring connections.
- Verify calibration: Cross-check machine water levels and temperature readings against manual sensors.
Quarterly & Annual Routines -
- Descale heat exchangers: Clear mineral buildup (especially inside heat recovery units like AquaTherm) to maintain optimal thermal transfer.
- Inspect structural mounts: Tighten frame bolts on high-spin washer-extractors.
- Analyse oil levels: Change gear reducer oil according to manufacturer run-hours.
By blending sector-specific throughput targets, utility-saving heat recovery loops, and a disciplined maintenance regime, commercial laundries can successfully protect their machinery, satisfy strict industry standards, and maximise profitability.
Cost Breakdown Analysis
To provide a clear picture of commercial laundry operational costs, here is the typical expense breakdown for a standard hospitality or healthcare processing facility. Labour remains the dominant operational expense, followed closely by linen replacement (par levels) and utility costs (gas, electricity, and water).
- Labour (45%): Covers sorting, loading, folding, and ironer operations. This is the largest area where automation provides a return on investment.
- Linen Replacement (25%): The ongoing cost of replacing damaged, worn, or lost textiles (shrinkage).
- Utilities (15%): Thermal energy for dryers and ironers, electrical energy for motors, and water intake/disposal costs.
- Chemicals & Maintenance (15%): Formulated wash chemistry, preventative machinery maintenance, and spare parts.
شارك هذا المقال:

Russell Macfarlane
Russell Macfarlane is a Senior Manager with over 30 years of experience helping the largest commercial laundry organisations in Australia become the most efficient. Based in Sydney, he specialises in designing high-performance industrial solutions that optimise floor throughput, slash utility overheads, and secure sustainable operational profitability.
مقالات ذات صلة.
14 سبتمبر 2026
How the Monorail Becomes a Source of Production Intelligence
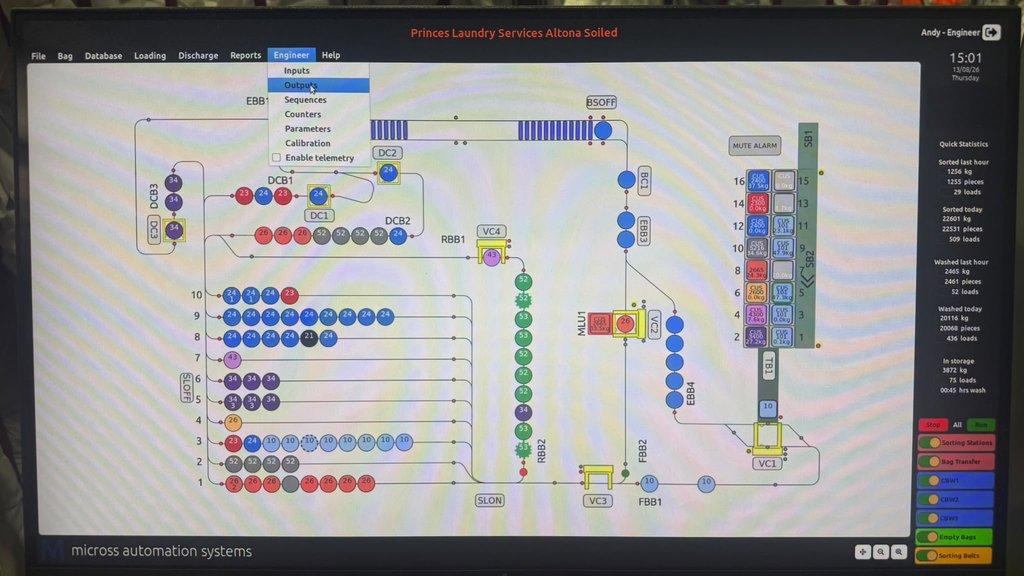
Almost everything processed through the plant passes through the monorail system at some stage. This gives us access to an incredible amount of operational data. When that information is captured and used effectively, the rail becomes much more than a method of storing and moving linen – it becomes a valuable source of production intelligence.