Analytics
know your cost to serve.
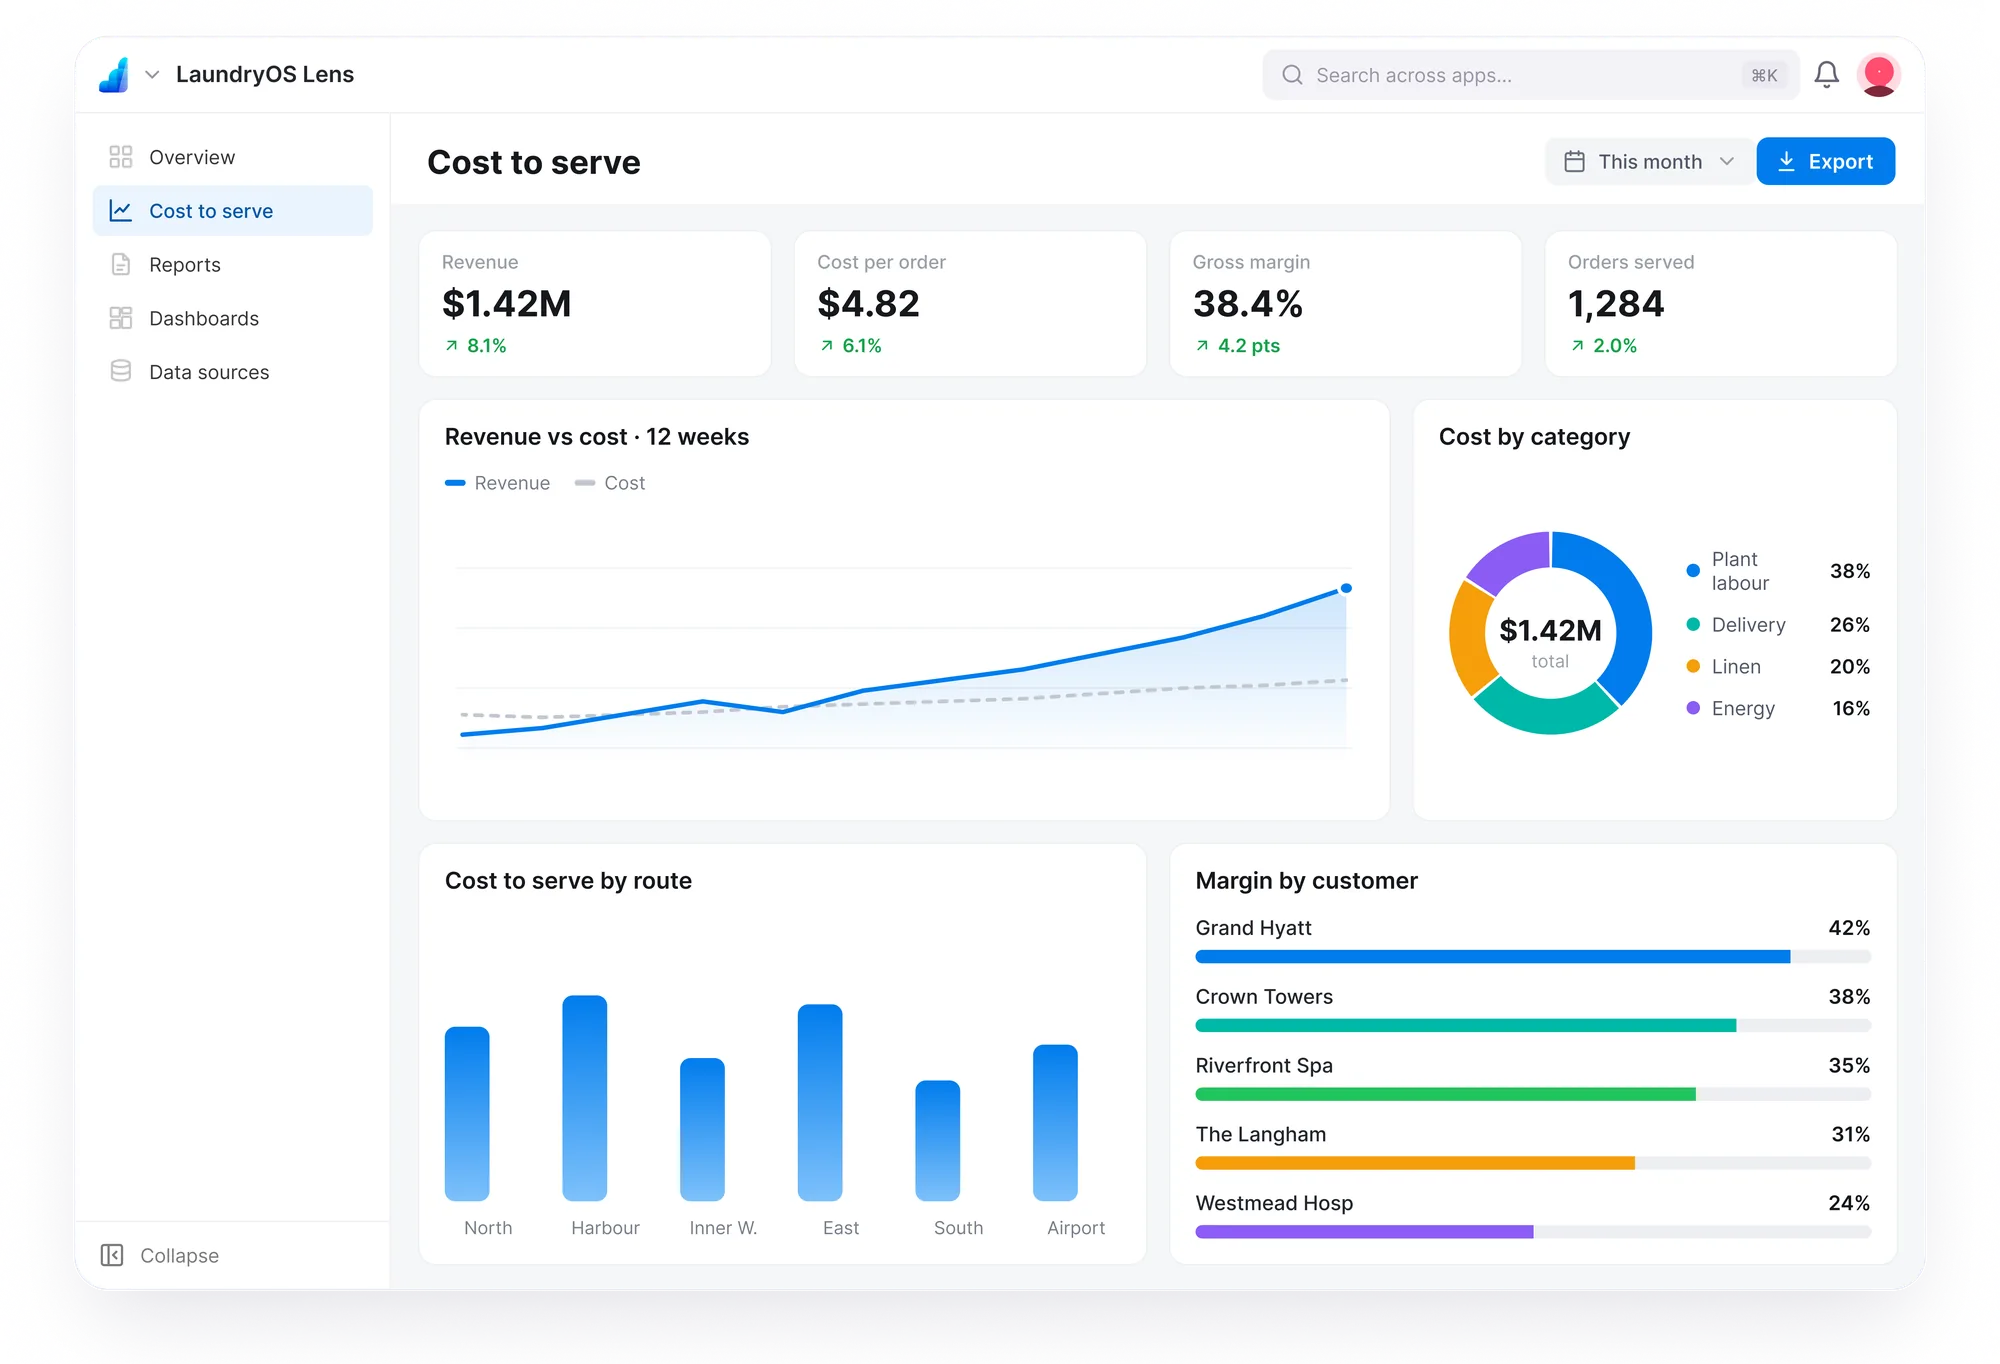
lens turns live operational data into dashboards and workbooks — including a pre-built cost-to-serve suite that shows which customers actually make you money.
built for one job. Done beautifully.
Cost-to-serve workbook
Pre-built analysis of customer profitability: delivery, handling and fulfilment vs revenue.
Custom dashboards
Charts and visualisations by route, account and period.
Drill anywhere
Filter and drill down into any customer or route.
Live, not exported
Reports run on the same data the apps write — no CSV shuffle.
Share with the team
Dashboards your ops and sales teams read from the same page.
Trends over time
Watch margin, volume and depletion move period on period.
lens. plays well with the rest of the suite
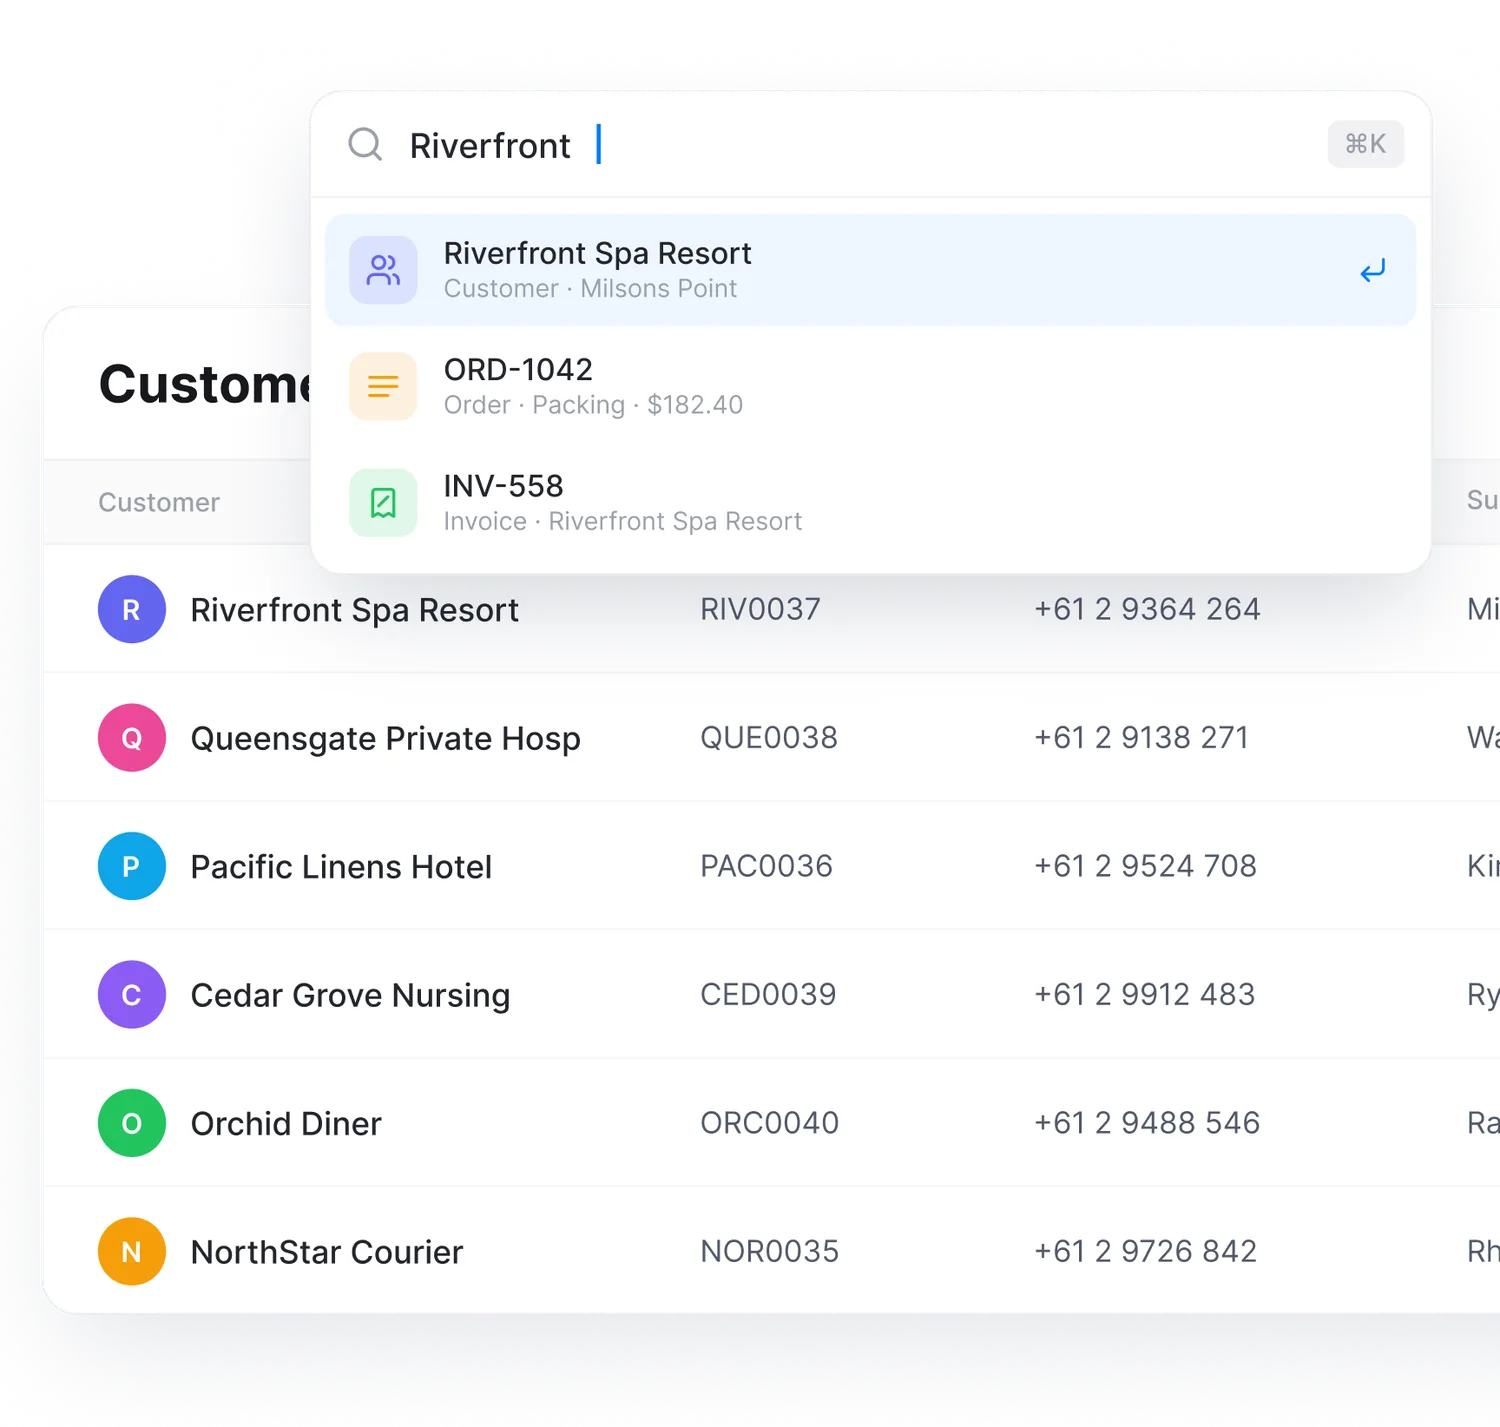
Same login, same customer record, same search — these apps share data with lens out of the box.